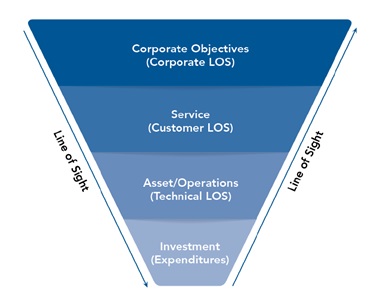
In Asset Management, levels of service (LOS) describe the outcomes customers experience through the services Town assets provide. Every day people use Town assets to travel safely, get clean drinking water, and many other services. Typically, customers are more focused on the services they receive (e.g. customer LOS), but behind the scenes the Town is making investments, delivering operations and maintenance, and weighing tradeoffs between cost and risk that ensure the customer receives this service (e.g. technical LOS).


The LOS measures in each asset management plan have been compiled into tables, beginning with the corporate goal of the assets/service followed by customer and technical measures. For some measures, a preliminary observation about what direction the data is trending in has been made. Trend observations were not always possible with only two years of data, and not all LOS metrics would even have a trend attributable to Town performance or service outcomes.
It is important to know that LOS measures do not have endorsed targets. Trend observations are made on the basis of general best practice related to the sustainability of assets, services, and finances. Trend observations do not indicate how close or far away the Town's LOS is from any hypothetical LOS target.
To read the tables, please use the legend below illustrating how to read the trend information.
Legend
| Symbol | Meaning | Symbol | Meaning |
 
| Trending up in the desired direction.
|  
| Trending down in an undesired direction.
|
 
| Trending down in the desired direction. |  
| Trending up in the undesired direction.
|
Roads Levels of ServiceCorporate Goal
Safe, well-maintained and managed transportation network for vehicles, cycling and pedestrians.
Customer Levels of Service
| Measure | 2019 Performance | 2020 Performance | Improvement Trend* |
Average pavement condition index of local roads (# / 100)
| 71 / 100 PCI | 70 / 100 PCI | 
|
| Average pavement condition index of collector roads (# / 100) | 65 / 100 PCI | 65 / 100 PCI | Trend not applicable |
| Number of winter events plowed and salted (events per year) | 76 events | 50 events | Trend not applicable |
| Average daily traffic on local roads (number of vehicles) | 675 vehicles per day | 675 vehicles per day | Trend not applicable |
| Average daily traffic on collector roads (number of vehicles) | 3,724 vehicles per day | 3,724 vehicles per day | Trend not applicable |
Number of customer complaints (includes quality, snow removal, and service issues - excludes bike lanes, traffic, etc.)
| 1483 complaints | 1481 complaints | Trend not applicable |
Technical Levels of Service
| Measure | 2019 Performance | 2020 Performance | Improvement Trend* |
| Capital Renewal Reinvestment Ratio (5 year rolling average) | 0.83% of replacement cost | 0.73% of replacement cost | 
|
| Kilometers of road patrols completed per year | 8,614 km inspected | 10,626 km inspected | 
|
| Number of winter events cleared by snow plowing (events per year). | 19 events | 18 events | Trend not applicable |
| Number of winter events cleared by salt application only (events per year). | 57 events | 32 events | Trend not applicable |
| Kilometers of roads repaired by crack sealing per year. | 13.1 km of road repairs | 0 km of road repairs |
|
| Kilometers of roads rehabilitated by resurfacing per year. | 3.9 km of road repairs | 1.7 km of road repairs | 
|
| Average utilized capacity on local roads (% / 1500 AADT) | 45% of traffic capacity | 45% of traffic capacity | Trend not applicable |
| Average utilized capacity on collector roads (% / 6500 AADT) | 57% of traffic capacity | 57% of traffic capacity | Trend not applicable |
| Percentage of local roads above planned capacity (% > 1500 AADT) | 9% of local roads | 9% of local roads | Trend not applicable |
| Percentage of collector roads above planned capacity (% > 6500 AADT) | 11% of collector roads | 11% of collector roads | Trend not applicable |
Regulatory Levels of Service
| Measure | 2019 Performance | 2020 Performance | Improvement Trend* |
| Number of lane-kilometers of collector roads as a proportion of square kilometers of land area of the municipality. | 3.6 lane kilometers | 3.6 lane kilometers | Trend not applicable |
| Number of lane-kilometers of local roads as a proportion of square kilometers of land area of the municipality. | 9.5 lane kilometers | 9.5 lane kilometers | Trend not applicable |
| For paved roads in the municipality, the average pavement condition index value. | 69 / 100 PCI | 68 / 100 PCI |
|
Bridges Levels of ServiceCorporate Goal
Safe reliable crossings that provide access for all mobilities.
Customer Levels of Service
| Measure | 2019 Performance | 2020 Performance | Improvement Trend* |
Percentage of bridges in "Fair" or better condition ( / 100%).
| 100% of bridges | 100% of bridges | Trend not applicable |
Average pavement condition of drivable bridges (PCI / 100).
| 63 / 100 PCI | 63 / 100 PCI |
|
Percentage of drivable bridges with cycling or pedestrian infrastructure.
| 81% of drivable bridges | 81% of drivable bridges | Trend not applicable |
Average daily traffic on drivable bridges (number of vehicles).
| 3,353 vehicles per day | 3,353 vehicles per day | Trend not applicable |
Number of customer complaints (bridge appearance, graffiti, etc.)
| 6 complaints | 9 complaints | Trend not applicable |
Technical Levels of Service
| Measure | 2019 Performance | 2020 Performance | Improvement Trend* |
Average bridge condition index value ( / 100, British Columbia method***).
| 64 / 100 BCI | 64 / 100 BCI |
|
Capital renewal reinvestment ratio (5-year rolling average).
| 0.81% of replacement cost | 0.90% of replacement cost |
|
Percentage of bridges requiring minor and/or major repairs within 5 years (per OSIM).
| 15% of bridges | 21% of bridges |
|
Percentage of bridges inspected within last 2 years.
| 100% | 100% |
|
Average condition of primary structural loading components (/ 100%).
| Fair - (62%) | Fair - (62%) | Trend not applicable |
Average condition of secondary structural loading components (/ 100%).
| Fair - (63%) | Fair - (63%) | Trend not applicable |
Average condition of non-structural auxiliary components (/ 100%).
| Fair - (63%) | Fair - (63%) | Trend not applicable |
| Average utilized traffic capacity of drivable bridges. | 79% of traffic capacity. | 79% of traffic capacity. | Trend not applicable |
Percent of drivable bridges with traffic above road class design.
| 28% of drivable bridges. | 28% of drivable bridges. | Trend not applicable |
Regulatory Levels of Service
| Measure | 2019 Performance | 2020 Performance | Improvement Trend* |
| Percentage of bridges in the municipality with loading or dimensional restrictions. | 1% | 1% | Trend not applicable |
| For bridges in the municipality, the average bridge condition index value (OSIM method***), / 100. | 72 / 100 BCI | 72 / 100 BCI | Trend not applicable |
| For structural culverts in the municipality, the average bridge condition index value (OSIM method***), / 100. | 73 / 100 BCI | 73 / 100 BCI | Trend not applicable |
***The Town maintains all regulatory requirements and practices related to Ontario Structural Inspection Manual Inspections and reporting, however a consultant review of Town conditions found that British Columbia's method of calculating BCI was a better indicator of state of good repair for the Town's assets.
Wastewater Levels of ServiceCorporate Goal
Provide accessible, available and reliable wastewater collection services that meet regulations at a reasonable cost.
Customer Levels of Service
| Measure | 2019 Performance | 2020 Performance | Improvement Trend* |
| Percentage of assets in "Fair" or better condition. | 82% of assets | 82% of assets |
|
Percentage of properties connected to the wastewater system.
| 97% of properties | 97% of properties | Trend not applicable |
Number of wastewater related customer complaints (includes back ups, service leaks, overflows – excludes billing, service requests, etc.)
| 33 complaints | 65 complaints | Trend not applicable |
Technical Levels of Service
| Measure | 2019 Performance | 2020 Performance | Improvement Trend* |
| Percentage of sewers CCTV inspected per year. | 6.34% of sewers | 2.99% of sewers |
|
Percentage of sewers flushed per year.
| 1.52% of sewers | 1.52% of sewers | Trend not applicable |
| Percentage of sewer laterals flushed per year. | 0.44% of laterals | 0.47% of laterals | Trend not applicable |
| Capital reinvestment to replacement cost ratio. | 0.15% of replacement cost | 0.00% of replacement cost |
|
| Number of sewer and lateral failures per year. | 7 sewer breaks | 7 sewer breaks | Trend not applicable |
Regulatory Levels of Service
| Measure | 2019 Performance | 2020 Performance | Improvement Trend* |
| Percentage of properties connected to the municipal wastewater system | 97% of properties | 97% of properties | Trend not applicable |
| The number of events per year where flow in municipal wastewater system exceeds system capacity compared to the total number of properties connected to the municipal wastewater system | 0 events per year. | 0 events per year. | Trend not applicable |
| The number of connection days per year due to backups compared to the total number of properties connected to the municipal wastewater system. | 0.00034% of available connection days | 0.00017% of available connection days | Trend not applicable |
| The number of effluent violations per year due to wastewater discharge compared to the total number of properties connected to the municipal wastewater system | 1 | 0 | 
|
Shortcut Links